Visualizations and Insights
Correlation Heatmap
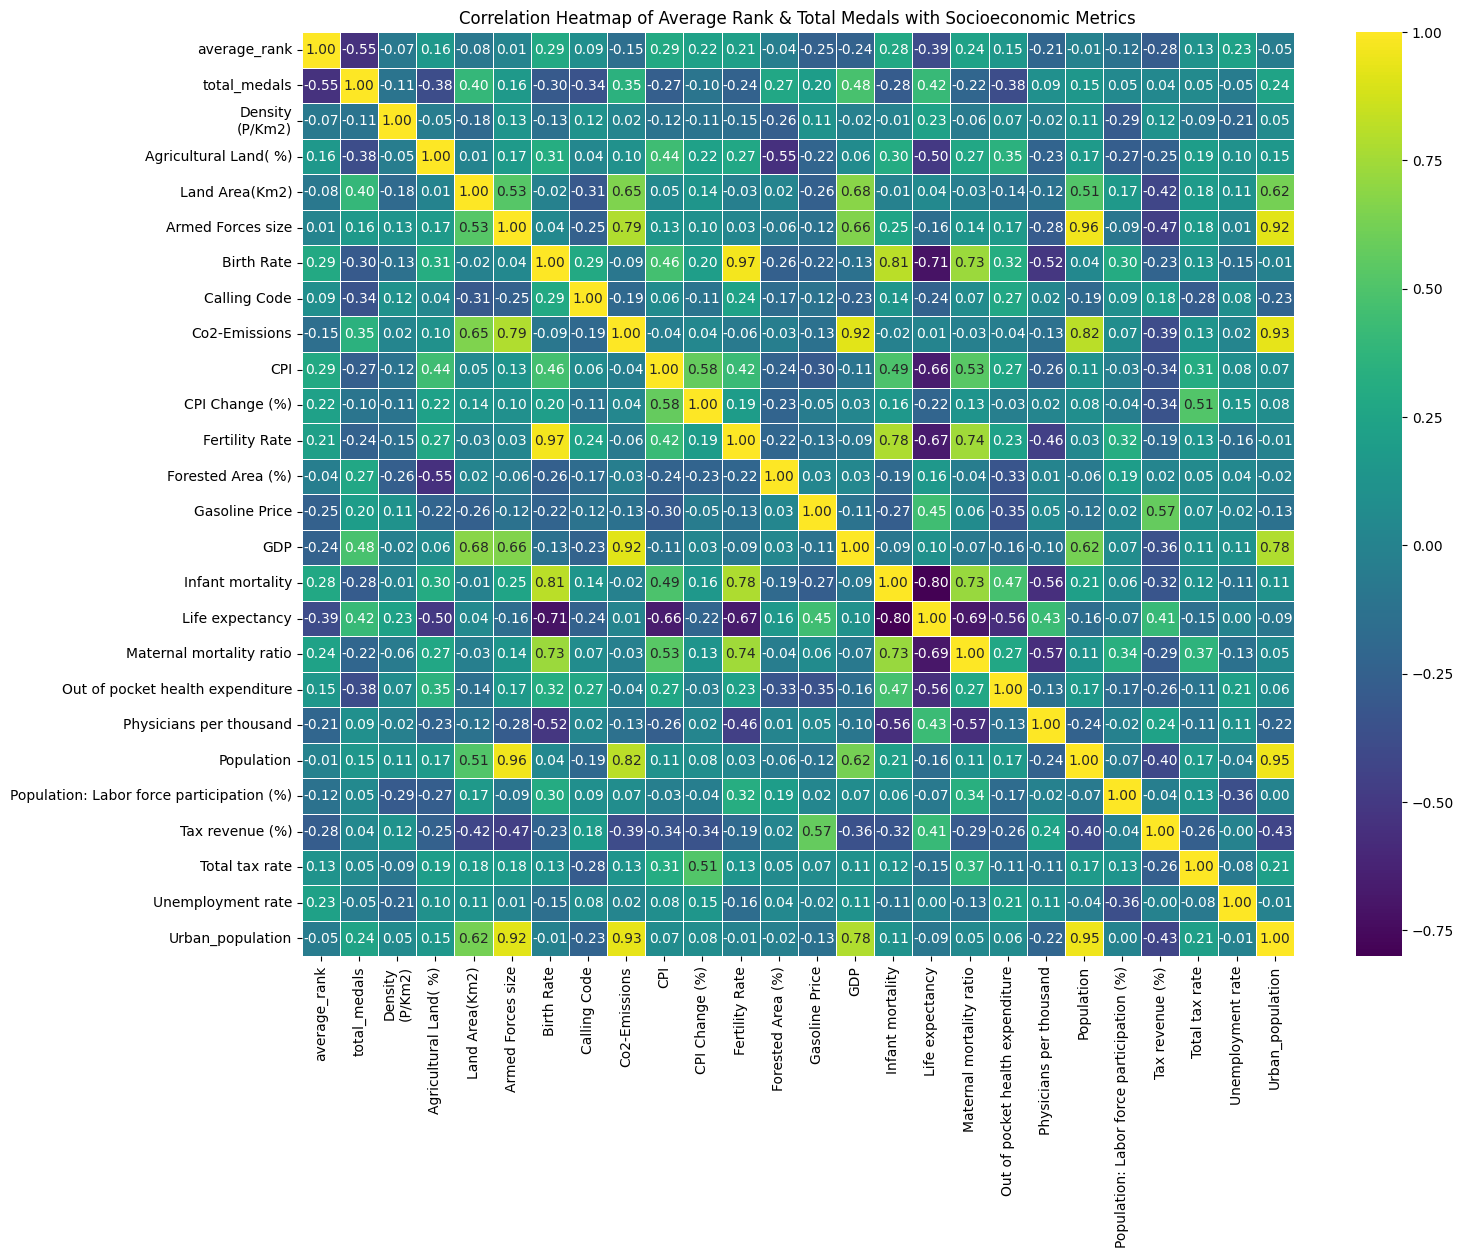
This heatmap shows the correlation of our key Olympics performance metric, "Average Rank" and "Total Medals" with the socioeconomic metrics including GDP, unemployment rate, etc.
Through this visualization, we hoped to get an overview of which socioeconomic metrics are related to olympics performance of a country. Here were some of the socioeconomic metrics highly correlated with olympics performance:
Average Rank (note that lower means higher ranking): Positively correlated with birth rate and CPI. Negatively correlated with life expectancy
Total Medals: Positively correlated with land area, CO2 emissions, GDP, life expectancy. Negatively correlated with % of agricultural land, out of pocket health expenditure, birth rate
Based on these findings, we decided to dig deeper into metrics with high correlation with olympics performance.
Total Medals vs GDP Scatterplot
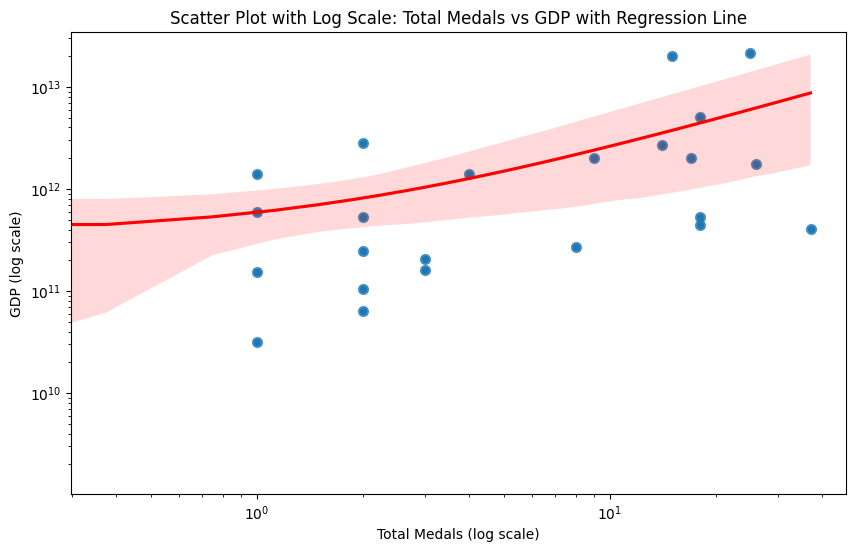
This scatter plot with regression line shows the relationship between number of total medals and GDP of a country. Log transformation was used to illustrate the relationship more clearly. This visualization further shows that there is a positive correlation between number of medals and GDP, as there the regression displays a positive slope. This is an interesting insight because it points at the importance of financial resources when it comes to the performance of atheletes in the olympics. Having a higher GDP means that there is a greater financial capacity for the country to support athelete's training, equipments, etc. and this directly reflects in their performance.
Total Medals vs Land Area / % of Agricultural Land
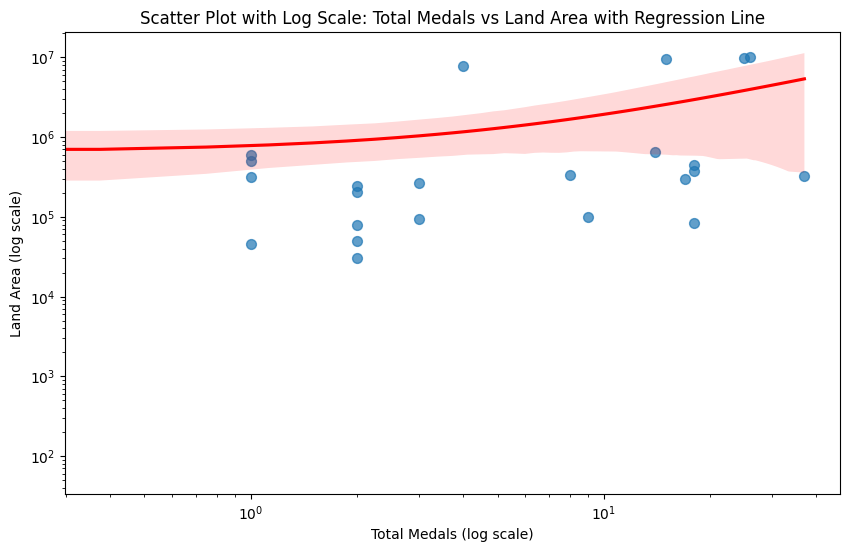
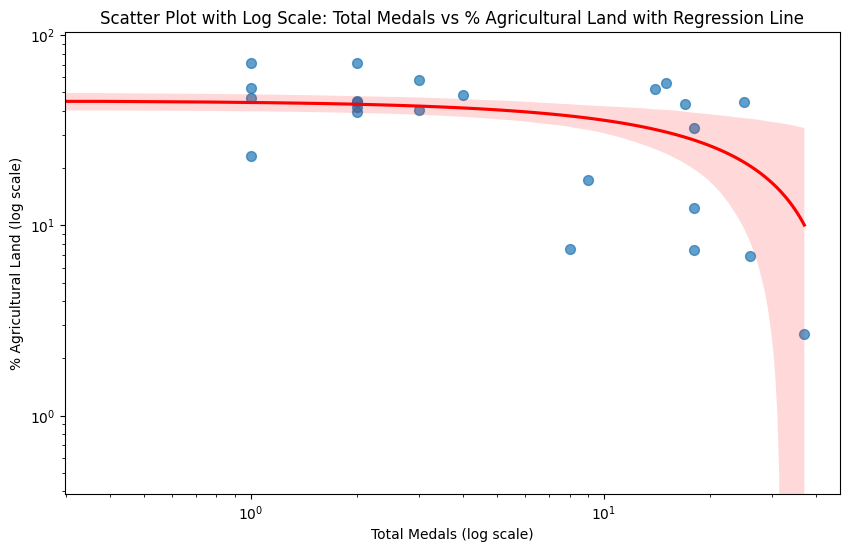
These two graphs are scatterplots that show the correlation of total medals with land area / % of agricultural land. These two charts show a very interesting insight because it suggests that while countries with higher land area tend to perform better, countries with high percentage of agricultural land perform worse. It is particularly interesting that percentage of agricultural land drops exponentially for countries with the highest medal count. These visualizations show that while having a high land area may be helpful, it is not as significant as being an industrial economy. Athletes from countries with an agrarian economy are less likely to perform well than those from industrialized economies. Furthermore, this trend is especially prominent for countries with a very industrialized economy.
Choropleth Map of Total Medals by Country
This choropleth map of total medals by country shows an overview of number of medals by country. Based on this map, one can observe trends based on geographical regions. Northern European countries tend to have the highest number of medals, with Norway being the highest. This further highlights the importance of economic conditions of a country, as Northern Europe tends to be the most affluent part of the continent. The United States and Canada also have a higher medal count, which is also consistent with the trend. On the other hand, South American countries tend to have the least number of medals, with most countries having awarded zero medals in the 2022 olympics. This visualization shows that the distribution of medals is heavily skewed toward certain regions of the world.
Bar Chart of Top 30 Countries in Medal Count
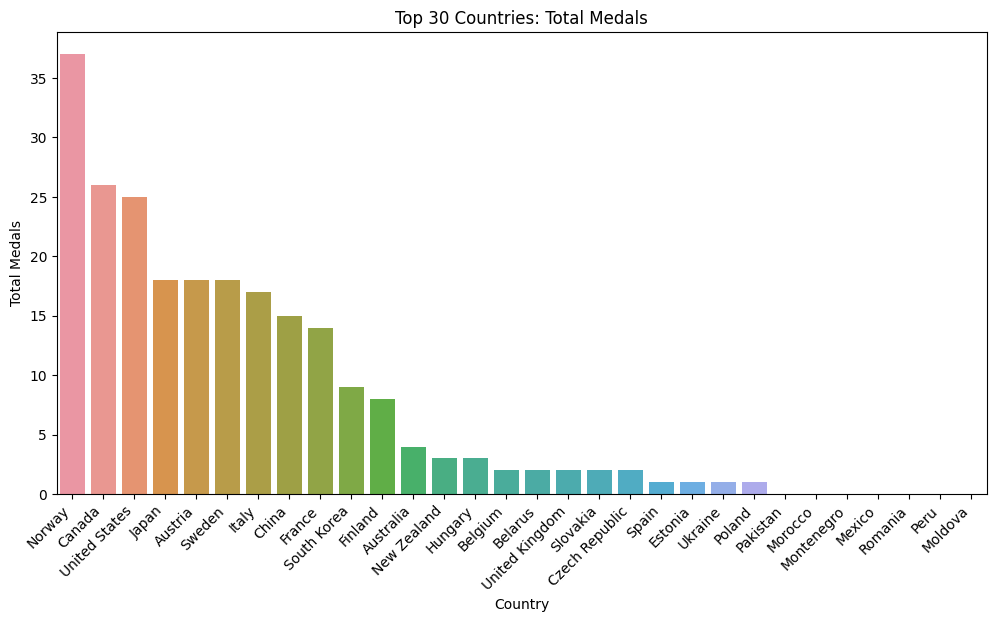
This bar chart illustrates the top 30 countries in medal count. As explained above, the top countries tend to be wealthy countries with economic resources. However, it is notable that the ranking does not exactly reflect economic capacity. For example, Norway is a clear leader in terms of medal count but is far from being the biggest economy of the world. The United Kingdom, despite being one of the biggest economies of the world, only scored two medals in total. This shows that while socioeconomic metrics are important, it does not necessarily determine athlete performance at the olympics.
Learning and Conclusions
In summary, our thorough examination of the connection between key Olympic performance metrics and various socioeconomic indicators has provided valuable insights into how a country's economic factors influence its athletes' success on the global stage. The correlation heatmap highlighted interesting links, such as the positive correlation between Average Rank and birth rate and the negative correlation with life expectancy. As we delved deeper, the scatterplots emphasized the crucial role of GDP in predicting a country's medal count, pointing to the significance of financial resources in supporting elite athlete performance. However, the performance disparities among countries with different socioeconomic statuses challenge the simplistic idea that wealth is the sole predictor of Olympic success.
The scatterplots comparing Total Medals with land area and the percentage of agricultural land offered nuanced perspectives. While larger land areas seemed advantageous, the inverse relationship with agricultural dependence suggested that economic diversification plays a key role in athletic success. The choropleth map highlighted regional differences, showing concentrations of medal-winning countries in affluent Northern European regions. Yet, outliers like Norway's exceptional performance, despite not being the largest economy, underscore the need for a more nuanced understanding.
The bar chart of the top 30 countries in medal count further reinforced the idea that while socioeconomic factors are important, they don't exclusively determine Olympic success. The United Kingdom's limited medal count, despite its economic strength, and the outstanding performance of some lower-income countries highlight the need for strategic resource allocation. Efficient spending on athlete training programs, state-of-the-art facilities, and effective management emerge as key factors that can potentially optimize a country's performance on the global sporting stage.
In light of these findings, the implications for policymakers and sports organizations are clear: while socioeconomic factors are undeniably important, a more holistic approach is necessary. Efficient resource allocation, strategic investments, and the development of comprehensive training programs can bridge the gap between economic capacity and athletic success. The Olympics, it seems, are not solely a reflection of a country's economic might but a complex interplay of factors that require a nuanced and thoughtful strategy to unlock the full potential of athletes across the globe.